Chapter 2: Description of Samples and Populations
STAT 218 - Week 3, Lecture 1
January 22th, 2024
This Week
This week we will…
- learn to examine “Spread of Distributions”
- identify the relationship between probability and the life science
- begin our exploration of statistical inference
- meet the family of normal curves
- calculate/assess areas under a normal curve
- assess Normality
Last Week’s Glossary - Check Your Understanding!
| parameter | statistic | descriptive statistics | central tendency |
| mean | median | mode | Quarto |
| source pane | render | code chunk | ordinal variable |
| categorical variable | numeric variable | nominal variable | YAML (what?) |
| discrete variable | Bill Gates | continuous variable | robustness |
| exponential distribution | bimodal | right-skewed | left-skewed |
Spread of Distributions
Let’s Remember This Example
Let’s assume we managed to collect data from our squirrels on campus :) Our class was divided into three groups, and each group measured the weights (lbs) of 10 squirrels. Here are the results:
Group 1: 1.25, 1.25, 1.25, 1.25, 1.25, 1.25, 1.25, 1.25, 1.25, 1.25
Group 2: 1.0, 1.0, 1.0, 1.0, 1.0, 1.5, 1.5, 1.5, 1.5, 1.5
Group 3: 1.0, 1.4, 1.2, 1.4, 1.1, 1.3, 1.6, 1.0, 1.2, 1.3
Dr. Demirci mentioned that looking at these numbers is so confusing. Can you please calculate the sample mean for them to summarize this data?
All these groups calculated the same mean, which is 1.25 lbs. Dr. Demirci seemed not so happy with this number.
- Why?
Spread of Distribution
- So far, we’ve explored the shapes and central tendencies of distributions
- but an effective depiction of a distribution should also capture its dispersion
- whether the observations in the sample are mostly uniform or exhibit significant variation.
- but an effective depiction of a distribution should also capture its dispersion
- We can also report this by using
- Range
- Standard Deviation
- Interquartile Range
Range
Range is one of the measures of dispersion indicating the difference between largest and smallest observations in a sample.
Let’s calculate range
- Group 1: \(1.25 - 1.25 = 0\)
- Group 2: \(1.5 - 1.0 = 0.5\)
- Group 3: \(1.6 - 1.0 = 0.6\)
Warning
- Range is easy to calculate, but very sensitive to extreme values
- It is not robust.
Standard Deviation and Variance

- Variance is denoted as \(s^2\), which is the standard deviation squared
- Let’s calculate standard deviation for each squirrel group!
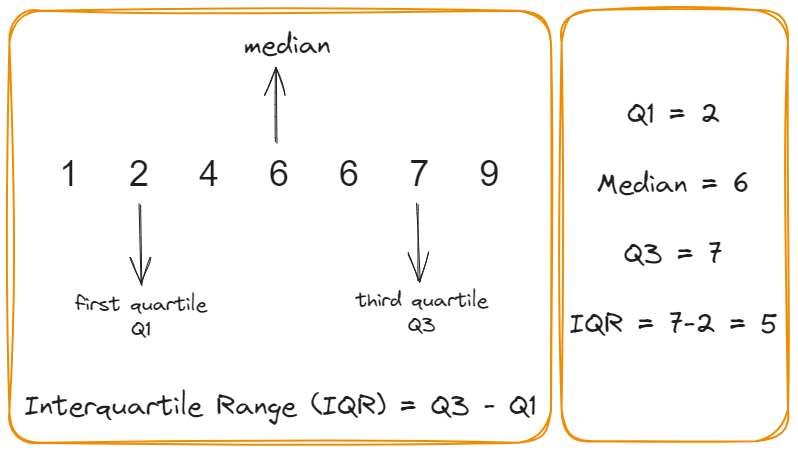
Quartile Range & Interquartile Range
Comparison of Measures of Dispersion
- The range is simple to understand, but it can be a poor descriptive measure because it depends only on the extreme tails of the distribution.
- highly nonrobust.
- The interquartile range, by contrast, describes the spread in the central “body” of the distribution.
- The standard deviation takes account of all the observations and can roughly be interpreted in terms of the spread of the observations around their mean.
- However, the SD can be inflated by observations in the extreme tails.
- The interquartile range is a robust measure, while the SD is not robust.
Probability and the Life Sciences
Descriptive and Inferential Statistics
- Descriptive statistics are instrumental in describing, summarizing, and exploring our data.
- However, our ambitions often extend beyond the specific animals, plants, microorganisms, or units observed.
- We aim to construct models for prediction, make generalizations, and draw conclusions (inferential statistics) by looking at our sample characteristics.
- However, our ambitions often extend beyond the specific animals, plants, microorganisms, or units observed.
- BUT how can Homo sapiens make inferences in a complex and imperfect world, which typically surpasses their understanding?
Despite their best efforts, every piece of equipment they manufacture will inevitably have a failure rate.
Travel plans? Well, they can’t be sure that nothing unexpected will pop up. (Did our ancestors accurately predict their next evolutionary leap, or were they even aware of it? Probably too busy avoiding/hunting saber-toothed tigers .)
The effect they expect to see in your treatment group? Well, there is a risk involved with every treatment.
- How can they deal with uncertainties? (Discuss with your neighbor)
some of the sections based on Dawson’s chapter on probability (2008)
Statistical Theory, Probability, and Inferential Statistics
- Statistical theory provides guidance by,
- utilizing random sampling models and accounting for data variability.
- encouraging us to view our study data as a sample (a representative one) from a larger population,
- with the population being the primary focus of scientific or practical curiosity.
- AND most importantly, these inferences are shaped by the rules of probability!
- armed with the rules of probability, we can make informed decisions that increase the likelihood of a good outcome.
- And inferential statistics, with its roots in probability theory, allows us to calculate risks in our research.
from Dawson’s chapter on probability (2008)
Probability, Chance, and Life Science
- The concept of probability, or chance, holds significance in our scientific understanding of living systems.
- Certain biological processes are directly influenced by chance, such as
- The Law of Segregation and the occurrence of mutations.
- Certain biological processes are directly influenced by chance, such as
- Even when chance is not inherent in the biological process itself,
- experimental results are invariably influenced by it:
- random fluctuations in environmental conditions,
- chance variations in the genetic makeup of experimental animals.
- Chance also plays a role in the design of experiments;
- e.g., varieties of wheat may be randomly assigned to plots in a field.
- experimental results are invariably influenced by it:
from Samuels et al. (2016)
Probability and Inferential Statistics
Some important statements to understand
- Inferential statistics is based on the probability of a certain outcome happening by chance.(Dawson, 2008, p.59)
- A probability is a numerical quantity that indicates the likelihood of an event.
- The probability spans from 0 (no likelihood of the event occurring), to 1 (a guaranteed outcome).
- both of which are quite rare in life.
- Events in life science usually have probabilities ranging between 0 and 1.
- p value: a probability value indicating the occurrence of an event by chance.
- percentage (%): a p value multiplied by 100.
- Probability of an event can be the long-run relative frequency of occurrence of the event*
- *(Keep in mind that there are other views on this, but that is the beyond the scope of our course)
Quick Reminders from High School Probability Lectures
- Coin tossing
- What is the probability of getting heads in a single toss of a fair coin?
- See Example 3.2.1 in our course textbook!
- What is the probability of getting heads in a single toss of a fair coin?
- Dice rolling
- “If you roll a fair six-sided die, what is the probability of getting a 6?
- See Example 3.5.1 in our course textbook!
- “If you roll a fair six-sided die, what is the probability of getting a 6?
Important
- The calculation of these probabilities is based on discrete probability distributions of categorical/discrete variables.
- Tomorrow, we will delve into the calculation of probabilities for continuous variables.
References
Gail F. Dawson, CHAPTER 7 - Probability, Editor(s): Gail F. Dawson, Easy Interpretation of Biostatistics, W.B. Saunders, 2008, Pages 57-62, ISBN 9781416031420, https://doi.org/10.1016/B978-1-4160-3142-0.50013-4. (https://www.sciencedirect.com/science/article/pii/B9781416031420500134)
Samuels, M. L., Witmer, J. A., & Schaffner, A. A. (2003). Statistics for the life sciences (Vol. 4). Upper Saddle River, NJ: Prentice Hall.