| Smoking_Status | Frequency |
|---|---|
| FALSE | 742 |
| TRUE | 484 |
| Total | 1226 |
Chapter 2: Description of Samples and Populations
STAT 218 - Week 2, Lecture 1
January 16th, 2024
Today’s Menu
In this lecture, we have
- Glossary
- Variables
- Frequency Distributions
- Summarizing Categorical Data
- Ungrouped Frequency Distribution Table
- Bar Chart
- Summarizing Numerical Data
- Grouped Frequency Distributions
- Histogram
- Grouped Frequency Distributions
- Summarizing Categorical Data
Glossary - Check Your Understanding!
| anectodal evidence | environment pane | observational study | sampling error |
| climate change | experimental study | observational unit | simple random sampling |
| clustered random sampling | life | output pane | squirrel |
| coding | missing data | population | stratified random sampling |
| console pane | nonresponse bias | randomness | sustainable development goals |
| data | nonsampling error | RStudio | uncertainty |
| data frame | object assignment operator | sample | variability |
| histogram | bar chart | dotplot | bar chart |
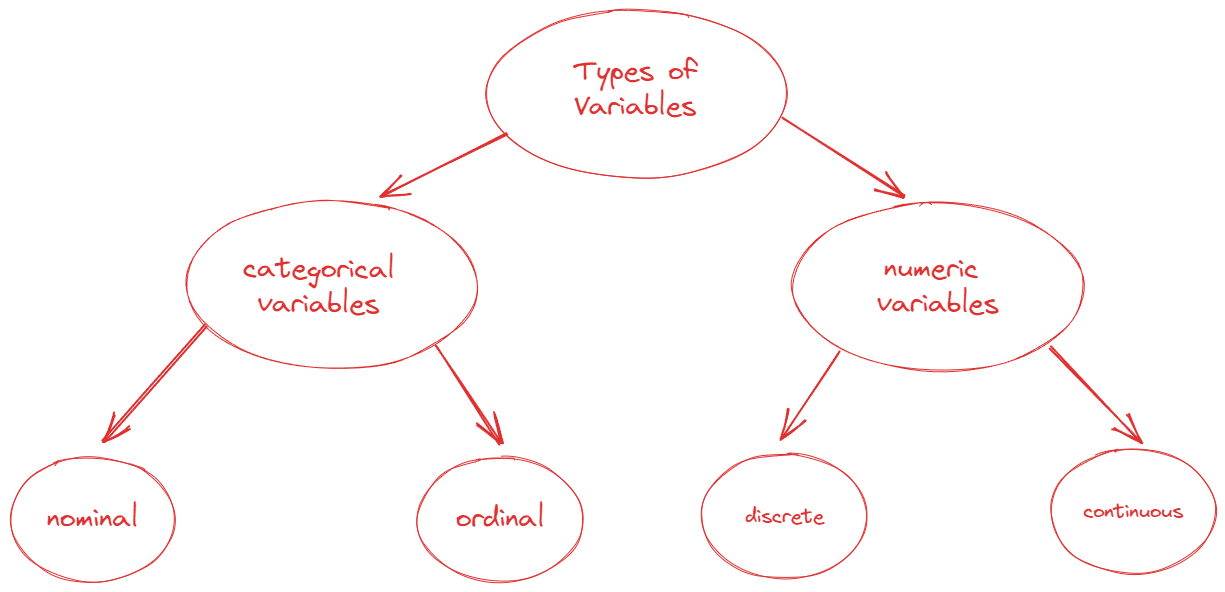
What is a Variable?
Variable: It is a characteristics of an observational unit that can be assigned a number or a category.

Categorical Variables - Nominal & Ordinal
- Nominal Variables are those which categorized into distinct groups without any order or hierarchy
- e.g., blood type, color of a flower, sex of a squirrel…
- Ordinal Variables are those which can be ranked in a meaningful way.
- e.g., The stages of a disease
- Strongly Disagree, Disagree, Neutral, Agree, Strongly Agree
- no credit, partial credit, full credit.
- Freshman, Sophomore, Junior, Senior
Numeric Variables - Discrete
- Discrete Variables are those whose possible values can be listed. In other words, there are some spaces between those possible values
- Count of bacteria colonies in a petri dish
- Number of chromosomes in a cell
Numeric Variables - Continuous
- Continuous Variables are those that can be measured on a continuous scale.
- e.g., weight of a squirrel
- Alkaline phosphatase level (U/l) in a blood sample
- height of a tree
Warning
The boundary between continuous and discrete variables is not fixed or inflexible.
Notations
- We employ a symbolic convention to differentiate between a variable and an observed value of that variable.
- \(Y = weight\) (Variable)
- \(y = 12.8\) lb (Observed Value)
Vocabulary Time!
Parameter: A number represents the entire population (e.g., population mean).
Statistic: A number calculated from sample data (e.g., sample mean).
Descriptive Statistics: Statistics used for describing and summarizing our data.
Inferential Statistics: Statistics used for making predictions and draw conclusions.
Descriptive Statistics
Generally, we used descriptive statistics to understand the shape, center, and dispersion in our data set.
Descriptive statistics might be reported either as in a tabular or a visual format.
Frequency Distributions
Introduction
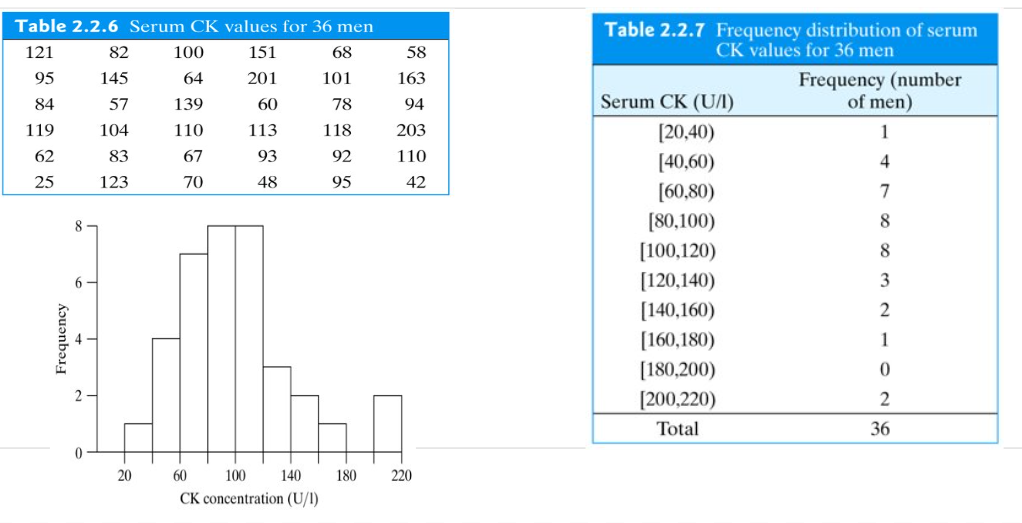
- A frequency distribution is a representation of the frequency, indicating how often each value appears in a dataset.
- This information can be conveyed through tables or, more visually, using a graph.
Summarizing Categorical Data
A Frequency Distribution Table
In this section, you will see two examples for summarizing a single categorical variable.
Bar Chart
A visual representation of categorical data that illustrates the quantity of observations within each category.

Another Example
| Likert_Response | Frequency |
|---|---|
| Strongly Disagree | 13 |
| Disagree | 21 |
| Neutral | 18 |
| Agree | 23 |
| Strongly Agree | 25 |
| Total | 100 |
Summarizing Numerical Data
Grouped Frequency Distributions

Histogram
- A visual representation of the distribution of a dataset.
- The x-axis represents the range of values in the dataset, divided into bins, and the y-axis represents the frequency or count of data points within each bin.
No Gaps between Bars: Unlike a bar chart, there are no gaps between the bars in a histogram because the bins are contiguous.
- Histograms provide insights into the underlying distribution of a dataset, helping to identify patterns, detect outliers, central tendency, and variability.

