Random Sampling

STAT 218 - Week 1, Lecture 2

January 10th, 2024

Today’s Menu

In this lecture, I will be briefly talking about

  1. FAQ From the Last Lecture
  2. Incomplete Parts of Yesterday
  3. An Introduction to Random Sampling

From the Last Lecture - I

  • Where can I get a copy of this book?
    • There are few options that I found
      • Course Reserves
      • Pearson - you can subscribe for 4 months
      • Cal Poly Textbook Facebook page: Rumor is that there is such a Facebook page where students sell textbooks at low prices.

Random Sampling

  • We have talked about the steps of how to design a study in the last lecture.
    • Among these steps, we decided that there is a need to have a data-gathering methods to address our research question with data.
    • We also agreed that there should be a representative sample to be able to make inference about our population of interest.
  • Let’s dive into these terms.

Population and Sample

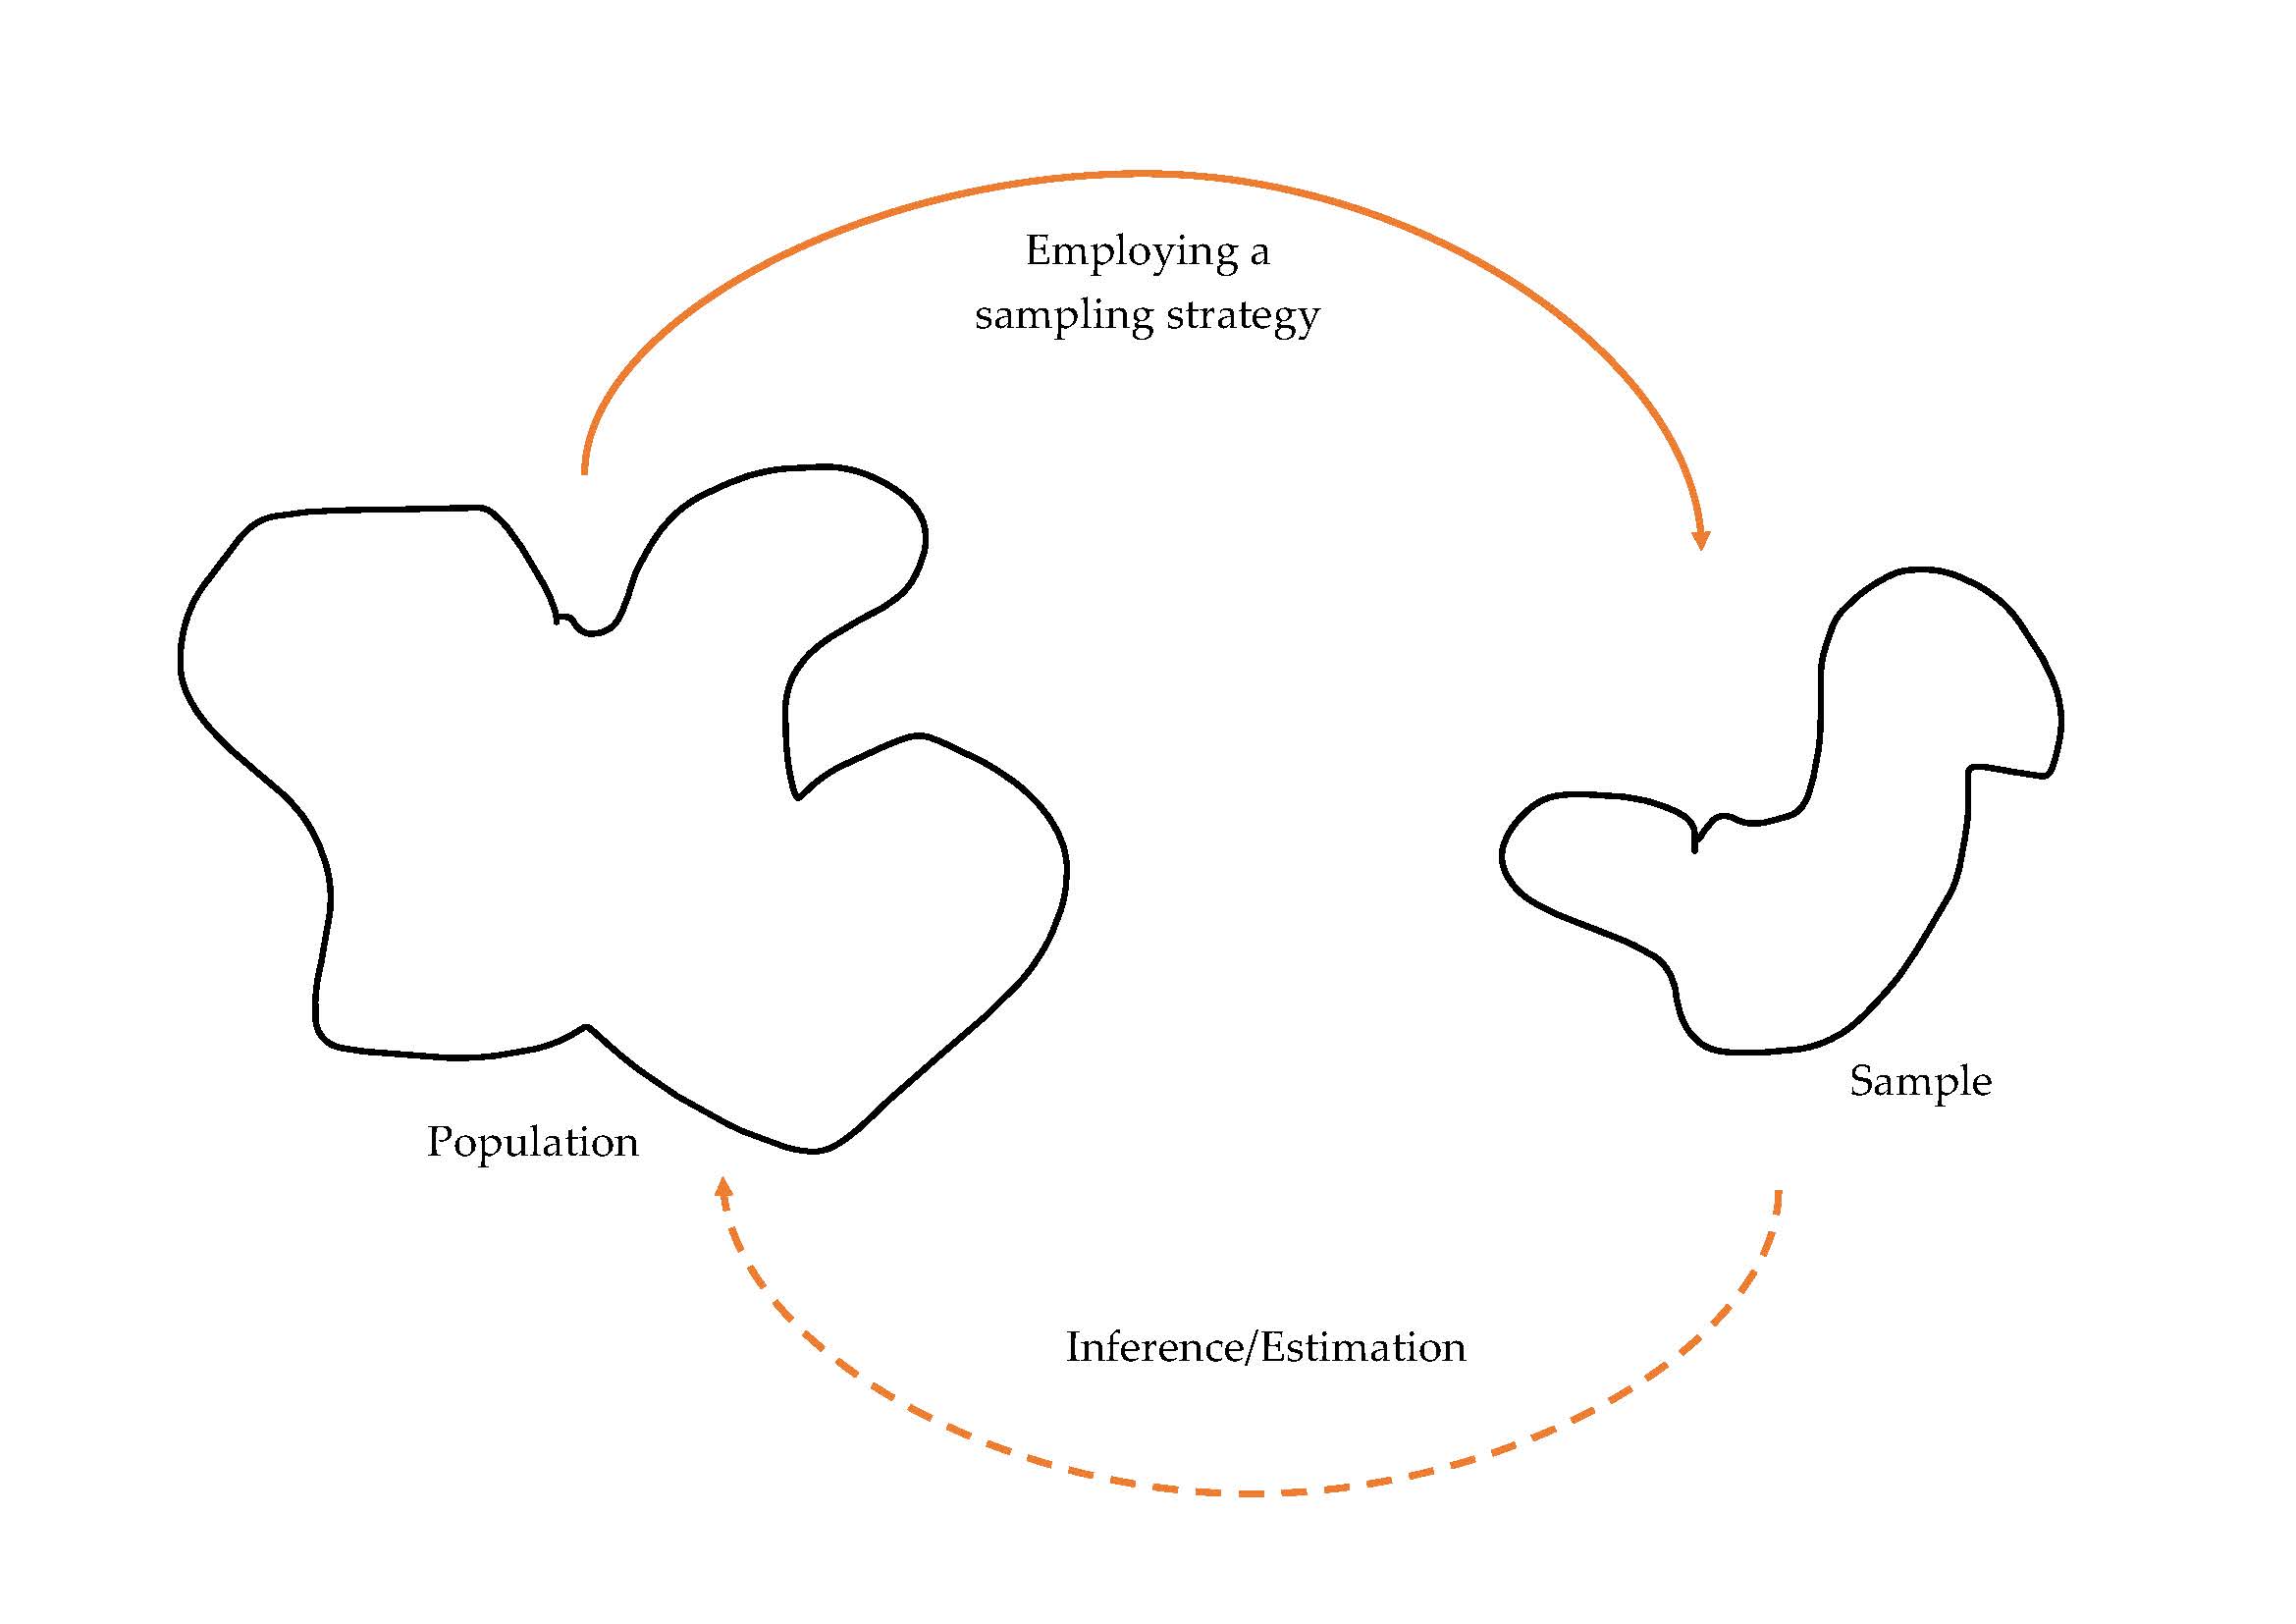
  • population: consists of all subjects/participants/observational unit of interest (e.g., all squirrels in Cal Poly)

  • sample: a subset of a population with size n.

  • Generally, we would like to estimate something or make inferences about something that we want to know by selecting a sample from the population of interest.

  • e.g. Eighteen (n = 18) squirrels lived in Cal Poly.

Simple Random Sample

If a sample is determined through simple random sampling, it means that

  • Every item, subject, specimen, or observational unit in the population has an equal chance of being selected in that sample.
  • The selection of these members of the sample are chosen independently of each other.

How to Choose A Random Sample

To be able to gain benefit from employing randomness, we generally use tools to eliminate bias.

Here are the steps for choosing a random sample of n observational units from a population of interest.

  • Determine the sampling frame: Give a unique ID number for each member (e.g., from 01 to 50).
  • Start reading numbers from a Random Digits Table or a computer.
  • Ignore any number that is not present in your population (e.g., 72)
  • Ignore any repeated occurrence of the same number.
  • Continue until the intended sample size is reached.

Employing Randomness

OR

  • Let’s play with our applet

Practical Concerns

  • In many cases, choosing and implementing simple random sample is either difficult or impossible
    • What should we do, then?
    • How can we label ALL the squirrels in Cal Poly?

Nonsimple Random Sampling Methods

  • Of course, there are other random sampling options that are not simple. Two of them are:

    • Random cluster sampling: Remember that we gave a unique ID number for each member (e.g., from 01 to 50)
      • In random cluster sampling, unique ID numbers are assigned to clusters or groups of observational units (e.g., from 01 to 50), and then all the observational units in those clusters are recruited for the study.
    • Stratified random sampling: Our population of interest may consists of various strata (e.g., age groups, biological sex, geographical region, grade levels of students).
      • After determining the strata, multiple simple random samples are drawn from each stratum, and these multiple samples collectively represent a representative sample of the population of interest.

Stratified vs Cluster Sampling

Stratified sampling

Stratified Random Sampling

Dan Kernler, CC BY-SA 4.0, via Wikimedia Commons

Cluster sampling

Random Cluster Sampling

Dan Kernler, CC BY-SA 4.0, via Wikimedia Commons

Sampling Error vs Nonsampling Errors

  • Sampling Error: The discrepancy between the sample and the population of interest.
    • It is crucial to quantify this because that makes statistics one of the backbones of scientific thinking.
    • There will always be a sampling error BUT
      • If we use some nonrandom sampling techniques, sampling error will become unpredictable (sampling bias)
  • Nonsampling Error: An error caused by other factors rather than sampling error.
    • wording of the questions in a questionnaire
    • nonresponse bias: e.g., bias occurs because of participants who are not responding some of the questions or not returning a written survey.
    • missing data: e.g., experimental living organisms may die during the experiment, human subjects fail to participate in some/all of the sessions of a treatment group.